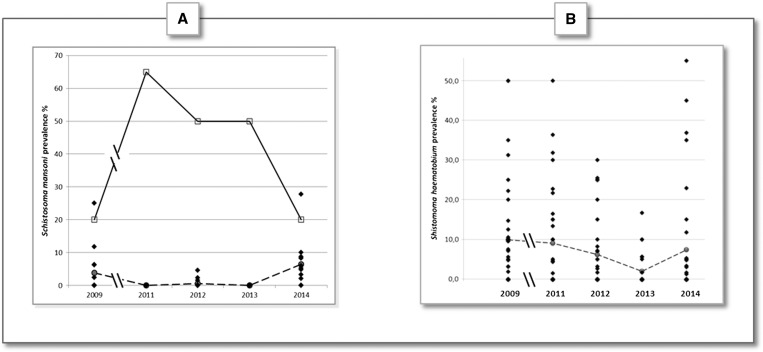
Figure 4.
Schistosoma mansoni and Schistosoma haematobium prevalence course of reported in villages that have at least one positive case between 2009 and 2014. (A) Schistosoma mansoni prevalence was assessed in each village from 2009 to 2014. Only the 16/53 villages which had positive at least once between 2009 and 2014 are represented. The continuous line linking empty squares represents S. mansoni prevalence in Assoni only. The dashed line linking the gray spots represents the average prevalence of S. mansoni in 15 other villages (i.e., excepted Assoni). (B) Schistosoma haematobium prevalence was assessed in each village from 2009 to 2014. Only 35/53 villages that had at least one positive case between 2009 and 2014 are represented. The dashed line linking the gray spots represents the average prevalence for all the 35 villages.

