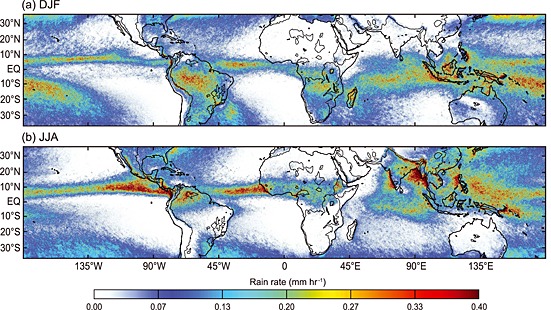
Figure 1.

Precipitation climatology expressed in average rain rates (mm h−1) from all TRMM Distinguishable Rain Areas (DRAs) during the months of (a) DJF and (b) JJA from 1998 to 2013. The black contour inside the continental regions represents the 700 m elevation.
