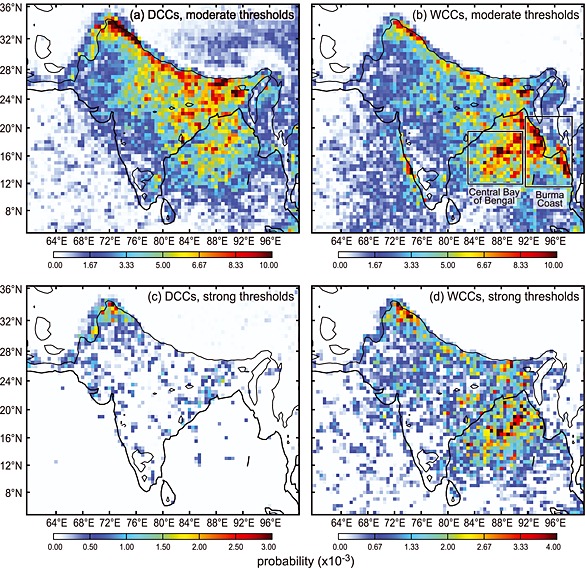
Figure 8.

Geographical distribution of the probability of finding (a) DCCs with moderate thresholds, (b) WCCs with moderate thresholds, (c) DCCs with strong thresholds, and (d) WCCs with strong thresholds during the months of JJA over Southeast Asia. Figures 8a–8d are zoomed‐in portions of Figure 5 over Southeast Asia. The black contour inside the continental regions represents the 700 m elevation. The probability is on a scale of 0 to 1 and is computed as the number of pixels identified as belonging to an echo category divided by the total number of pixels sampled by the TRMM PR over the given time period within a 0.5° × 0.5° grid element. Statistics for the rectangular regions are given in Table 1. Examples of the structures of BSRs occurring in the rectangular regions are shown in subsequent figures and discussed in the text.
