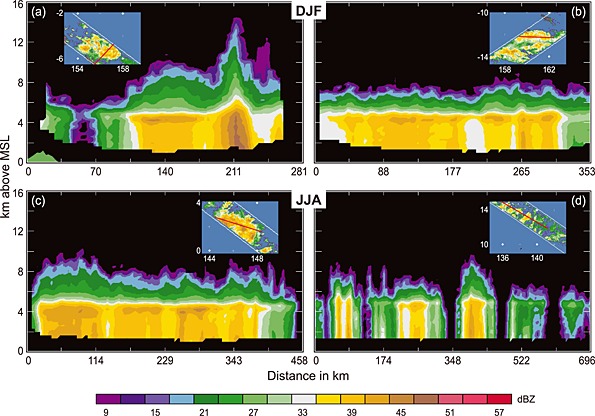
Figure 11.

Examples of storms containing BSRs in the blue rectangles that represent the warm pool region in Figure 10. TRMM PR reflectivity data in dBZ at 4 km are represented by the plan view insets in Figures 11a–11d. The white lines indicate the TRMM PR swath, and the red line indicates the location of the vertical cross section from left to right. Positive latitudes are in the Northern Hemisphere. Longitudes are all in the Eastern Hemisphere. Vertical cross sections of TRMM PR data representing robust stratiform precipitation from the blue rectangle in Figure 10a, during the months of DJF, are presented at 16:18 UTC, 21 January 2010 (Figure 11a) and 16:08 UTC, 14 January 2008 (Figure 11b). Vertical cross sections of TRMM PR data representing robust stratiform precipitation and widespread cellular stratiform from the blue rectangle in Figure 10b, during the months of JJA, are presented at 00:36 UTC, 23 July 1999 (Figure 11c) and 05:26 UTC, 5 August 2009 (Figure 11d), respectively.
