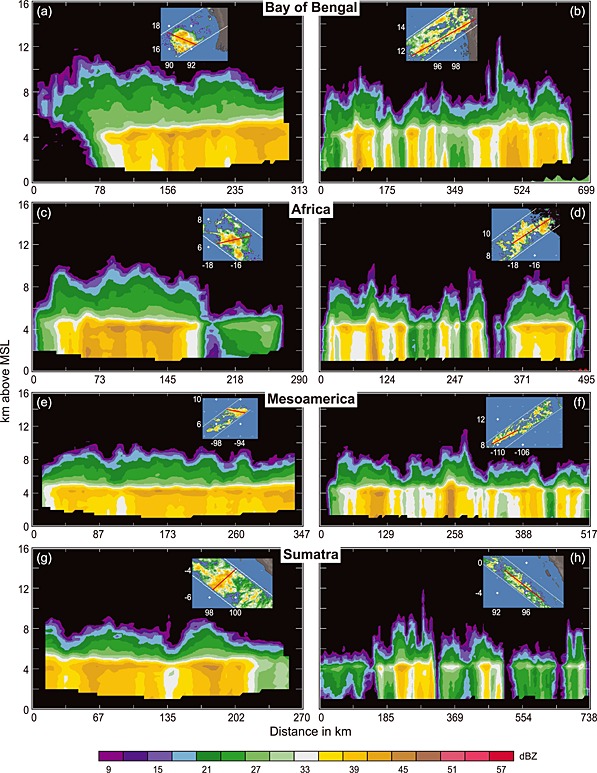
Figure 12.

Same as in Figure 11 but for the red rectangles that represent the monsoonal regions shown in Figure 10. (a, c, e, and g) Vertical cross sections of TRMM PR data representing robust stratiform precipitation and (b, d, f, and h) those representing widespread cellular stratiform precipitation. Examples of TRMM PR data are provided for each of the four red rectangles shown in Figure 10: 14:01 UTC, 3 June 2003 (Figure 12a) and 21:08 UTC, 28 June 2006 (Figure 12b) from the Bay of Bengal region (JJA); 11:51 UTC, 8 June 2011 (Figure 12c) and 12:19 UTC, 30 July 2006 (Figure 12d) from the coastal Africa region (JJA); 13:44 UTC, 11 July 2011 (Figure 12e) and 04:51 UTC, 13 August 2012 (Figure 12f) from the Mesoamerica region (JJA); and 10:04 UTC, 26 February 2002 (Figure 12g) and 15:50 UTC, 27 December 2010 (Figure 12h) from the Sumatra region (DJF).
