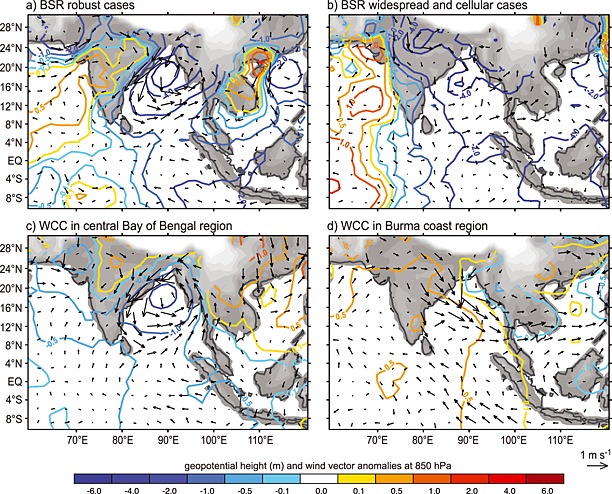
Figure 13.

ERA‐interim reanalysis composite maps of (a) 850 hPa geopotential height (m) and wind vector anomalies (m s−1) for times of occurrence of (a) BSRs with robust stratiform precipitation and (b) BSRs with widespread and cellular stratiform precipitation. (c and d) Same as Figures 13a and 13b but for WCCs with moderate thresholds in the central Bay of Bengal and Burma coast regions shown in the black boxes in Figure 8b, respectively. The topography is shown in gray shading.
