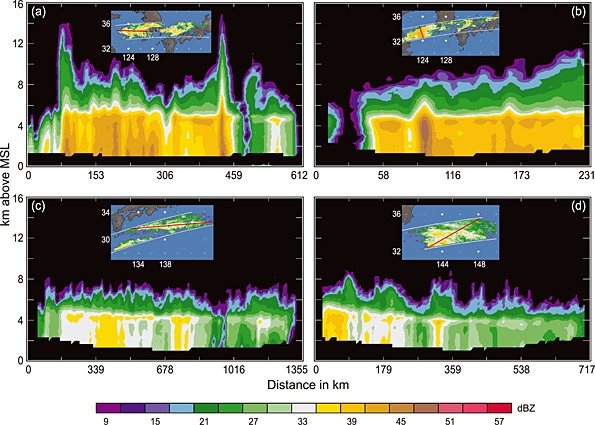
Figure 14.

Same as in Figure 11 but for the orange rectangle that represents the plum rain (or Mei‐Yu) region shown in Figure 10b. (a and b) Vertical cross sections of TRMM PR data representing robust stratiform precipitation and (c and d) examples of less intense rain with widespread cellular stratiform precipitation and sloping bright bands. Examples of TRMM PR data in the orange region are shown at the following times: 21:02 UTC, 10 July 2010 (Figure 14a), 15:04 UTC, 23 June 2001 (Figure 14b), 02:35 UTC, 5 June 2012 (Figure 14c), and 00:13 UTC, 3 June 2008 (Figure 14d).
