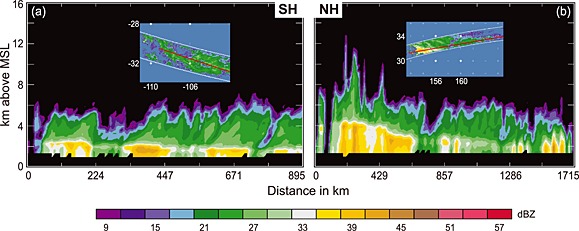
Figure 15.

Same as in Figure 11 but for the green rectangles that represent the midlatitude frontal regions shown in Figure 10. A vertical cross section of TRMM PR data representing a very low and sloping bright band feature is shown at (a) 10:22 UTC, 15 July 2012 from the green rectangle in the South Pacific region (Figure 10d). A vertical cross section of TRMM PR data representing a steeply sloping bright band is shown at (b) 23:56 UTC, 13 January 2001 in the North Pacific region (Figure 10a).
