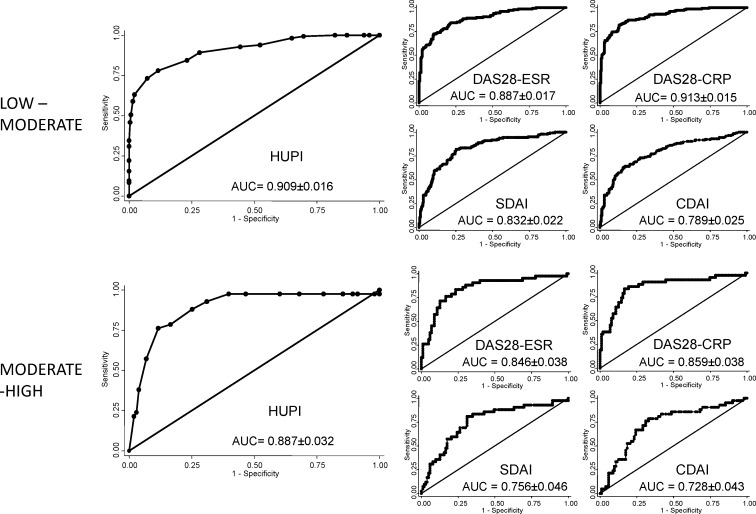
Fig 2. HUPI and DAS28 discriminate low-moderate and moderate-high disease activity better than SDAI and CDAI.
Receiver operating curves were plot using the “roctab” command of STATA, with the option graph. Data obtained from the PEARL cohort. The best cut-off point to discriminate between moderate and high disease activity was 9 (Table 3). The AUC of HUPI was systematically larger than those from the other indices (Fig 1 lower panels), although differences were only significant with SDAI (p = 0.0004) and CDAI (p = 0.0001).

