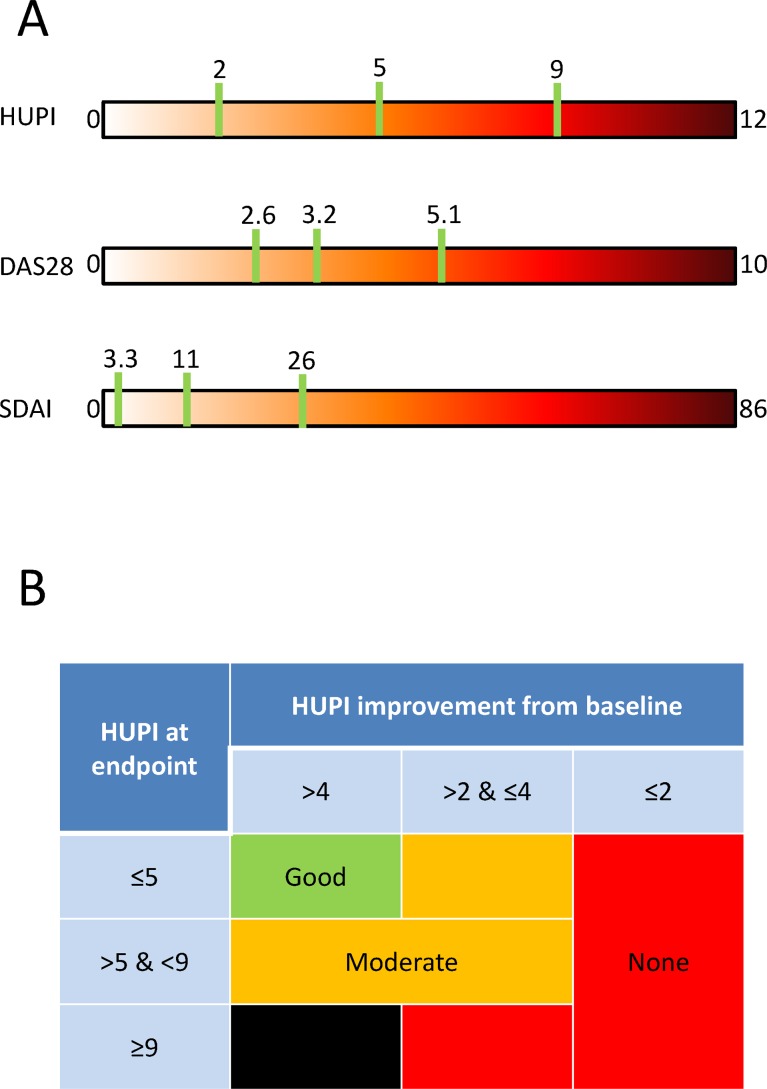
Fig 4. Cut-off points and response criteria for HUPI.
A) Comparison of cut-off points’ distribution along HUPI, DAS28 and SDAI’s range of values. B) Response criteria using HUPI based on its cut-off values for low, moderate and high disease, as well as minimal and relevant improvements. The black box means that in no case the HUPI can be ≥9 if the improvement in HUPI score is ≥4.

