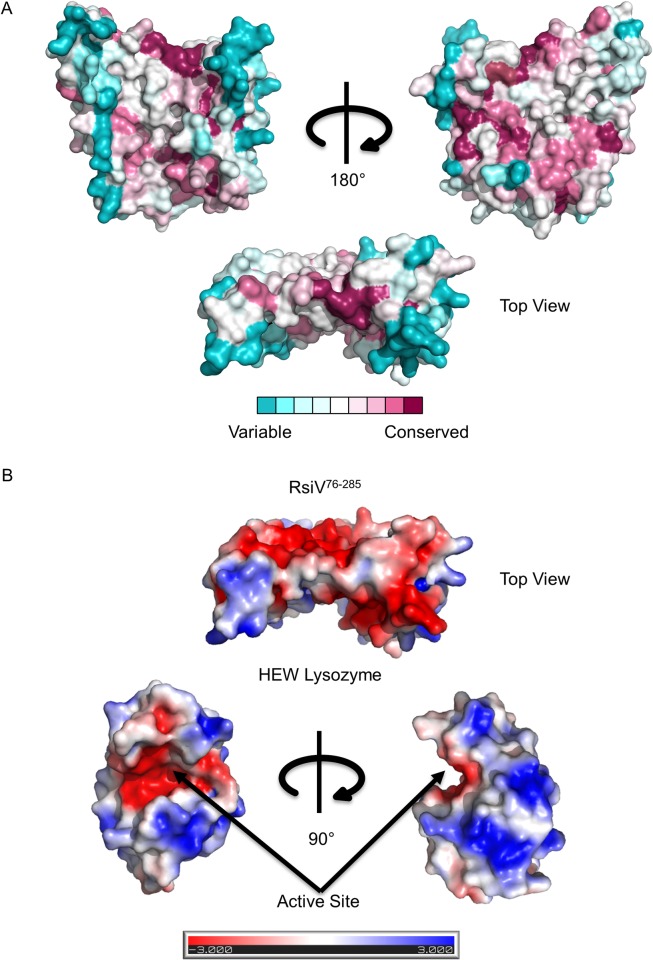
Fig 2. Regions of highest homology mapped on the structure of RsiV.
A. Space fill model of RsiV with lysozyme removed. The amino acid residues of RsiV are colored according to degree of conservation with 898 other RsiV homologs using ClustalW [36] (S1 Table). The ClustalW homology was overlaid on the RsiV structure using ConSurf [37,38]. The darker maroon color indicates higher conservation while white is neutral and the darker blues are the least conserved amino acid residues. The image on the right has been rotated 180° clockwise. Below is a top view of the lysozyme binding region of RsiV. B. Electrostatics and surface potentials were determined through modeling biomolecular solvation with the Adaptive Poisson-Boltzmann Solver (APBS) module with PyMOL. ±3 kT/e electrostatic potential is plotted on the solvent accessible surface of both RsiV76-285 and HEW lysozyme [99]. The top portion is a top down view of RsiV showing the lysozyme binding region. Below is the surface potential of lysozyme showing the active site and the region that interacts with RsiV.

