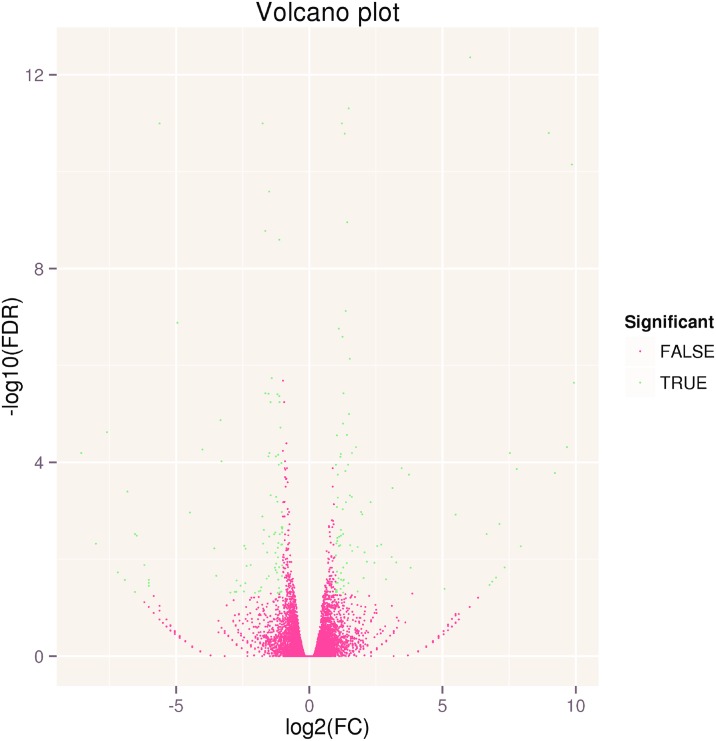
Fig 1. Volcano plot of RNA-Seq data.
A volcano plot is a scatter plot that is often used when analyzing micro-array data sets to provide an overview of interesting genes. The log2 (FC) (fold change) is plotted on the x-axis, and the negative log10 (FDR) (p-value) is plotted on the y-axis. The red point shows no differential gene expression with the absolute value of log2 (FC) less than 1 (FC = 2) and FDR no less than 0.05. The blue point show differentially expressed genes with the absolute value of log2 (FC) no less than 1 (FC = 2) and FDR less than 0.05.

