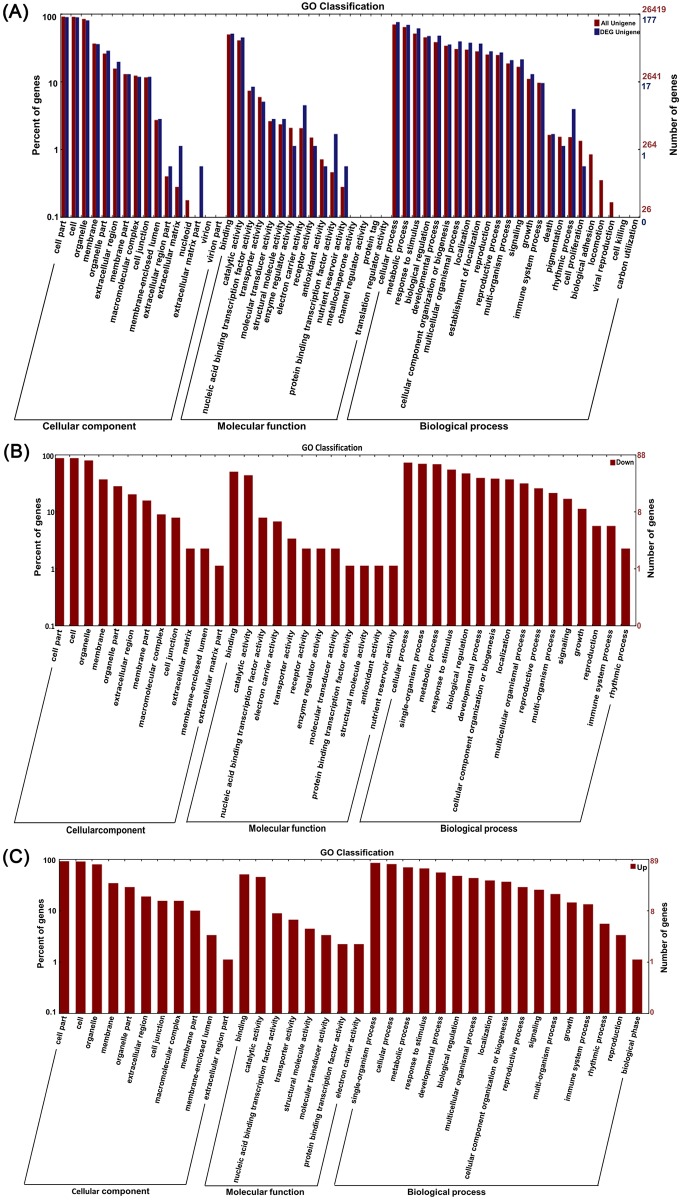
Fig 3. GO classifications of genes.
The results are summarized in three main categories: biological processes, molecular functions and cellular components by GO analysis. (A) GO classifications of all genes between the two treatments and all 177 DEGs between the two treatments. (B) GO analysis of the down-regulated genes in A1-vs-A2. (C) GO analysis of the up-regulated genes in A1-vs-A2.

