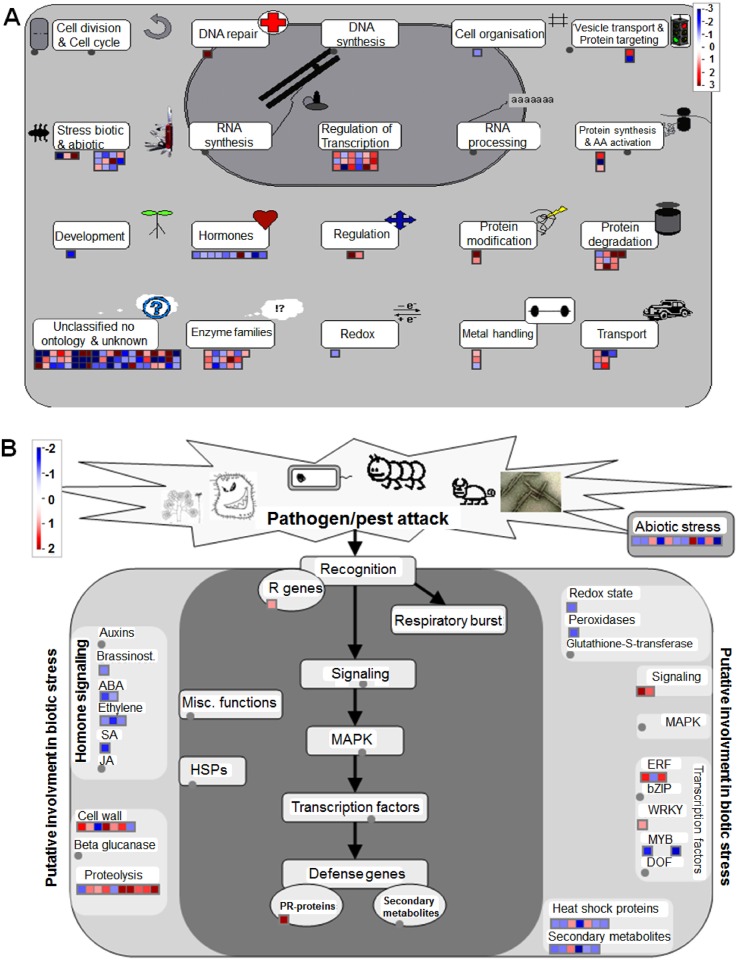
Fig 4. MapMan overview of cellular function (A) and biotic stress (B) showing all DEGs between the two treatments with exogenous myo-inositol.
The big grey circle is an illustrated map of nucleus. The small grey circle indicate annotated biological process (metabolites). The small squares represent individual genes. The color key represents RPKM normalized log2 transformed counts. Red represents up-regulation and blue represents down-regulation between two treatments with exogenous myo-inositol.

