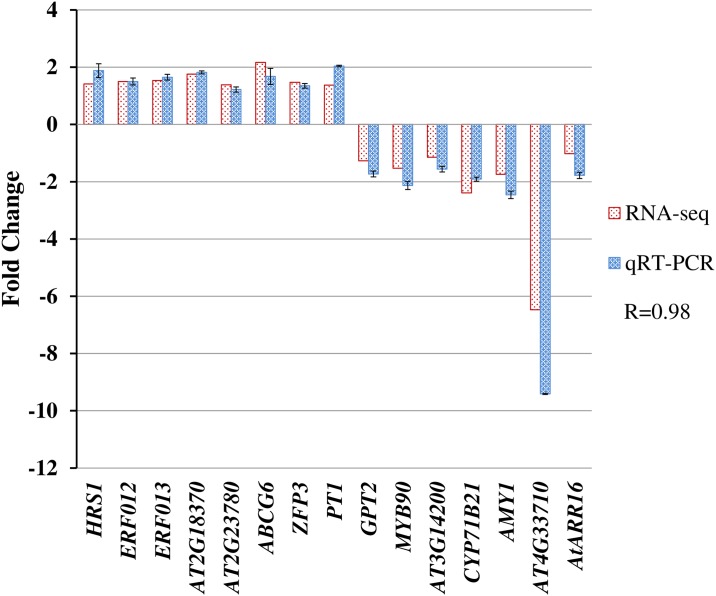
Fig 5. qRT–PCR validation of RNA-Seq results.
Fifteen genes were randomly selected from the DEGs (red columns) from the RNA-Seq data and were analyzed for differential expression changes (blue columns) of the genes. The results were the average of two biological replicate samples in triplicate. Error bars indicate the standard error of two biological replicates in qRT–PCR.

