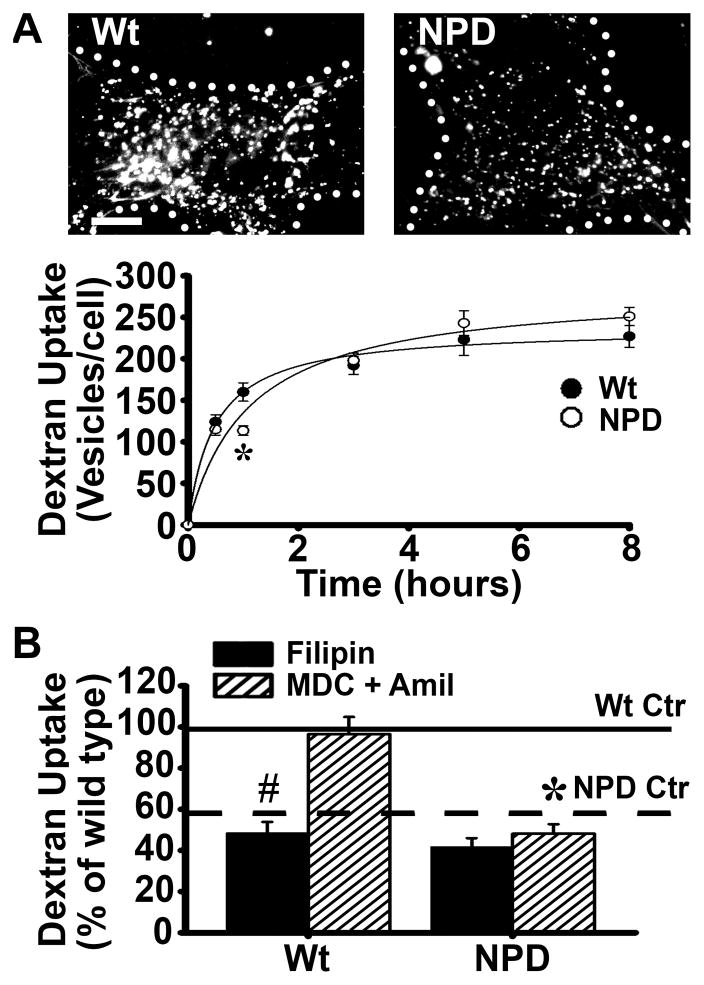
Figure 3.
Pinocytosis and its mediation by caveolae in NPD fibroblasts. A Microscopy images and quantification of the number of dextran-filled vesicles (fluorescent objects over background) associated with Wt or NPD fibroblasts incubated for varying periods of time at 37°C with media containing fluorescent dextran (microcopy images show one hour as an example). Dotted lines mark the cell borders, as determined from the corresponding phase-contrast images. Scale bar = 10 μm. B Dextran-filled vesicles were quantified after one hour incubation at 37°C in control untreated cells (either Wt Ctr or NPD Ctr) vs. cells treated with either 1 μg/mL filipin (Fil; to inhibit caveolar endocytosis) or with a cocktail of 50 μM MDC and 3 mM amiloride (MDC + Amil; to inhibit clathrin and macropinocytosis simultaneously). Uptake by control untreated Wt or NPD cells are shown as solid and dashed horizontal lines, respectively. A–B Data are the mean ± SEM. *Comparison between NPD and similarly treated Wt cells; #comparison with untreated (control without inhibitor) cells within each cell type (p<0.05 by Student’s t-test). In graph A, lines are regression curves, where R2 = 0.99 for WT and 0.97 for NPD.

