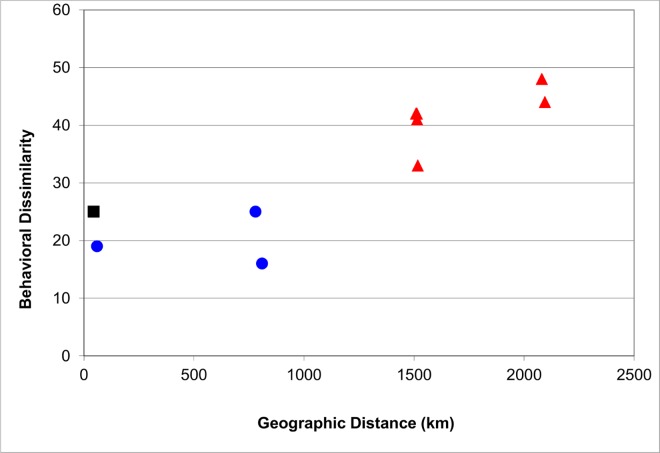
Fig 2. Behavioral dissimilarity (quantified as Manhattan distance; see methods for explanation) plotted against geographic distance among five gorilla study sties.
Each data point represents a dyad of two sites (two of the 10 dyads have the same value; hence only nine points are visible). As the geographic distance between sites increases, the dissimilarity in behavioral traits increases.

