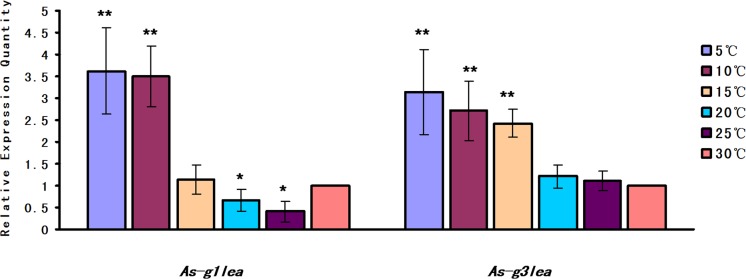
Fig 4. Relative expression of As-g1lea and As-g3lea mRNA in response to low temperature challenge.
The control group was treated at 30C, and the mRNA expression levels of As-g1lea, As-g3lea and gapdh were measured using quantitative real-time PCR 24 h after being incubated at the indicated temperature. Data are presented as the mean ± SD of triplicate experiments. Highly significant differences between the experimental and control groups are indicated with **P < 0.01, while significant difference are indicated with * 0.01 < P < 0.05.

