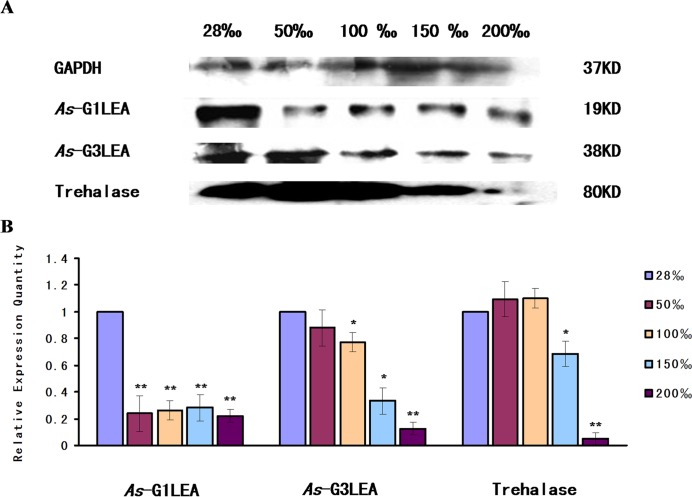
Fig 10. Western blot analysis of As-G1LEA, As-G3LEA and Trehalase under different salinity stresses.
(A) Western blotting analysis of the expressions of As-G1LEA, As-G3LEA and Trehalase proteins in response to salinity stress in A. sinica. The intensities of the As-G1LEA, As-G3LEA and Trehalase protein bands were normalized against those of GAPDH. (B–D) Values are expressed as arbitrary units of relative value. The expressions of As-G1LEA, As-G3LEA and Trehalase protein at 28‰ salinity were used as the control. Statistically significant differences are indicated with ** P < 0.01, while * represents 0.01 < P < 0.05.

