Figure 10.
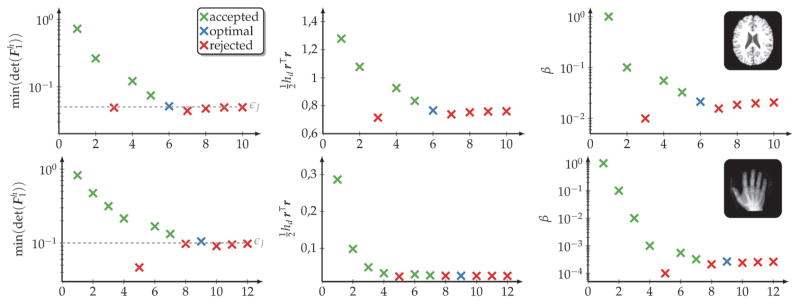
Exemplary illustration of the course of the parameter continuation in β for the quantitative results reported in Table 9. We refer to Table 9 and the text for details on the experimental setup. We report results for the brain images (top row) and the hand images (bottom row) for plain H2-regularization. For each experiment, we display (from left to right) (i) the trend of the minimal value of the determinant of the deformation gradient (the dashed line indicates the user-defined lower bound on , (ii) the trend of the L2-distance (hd is the grid cell volume and , r ∈ Rñ, ) and (iii) the trend of β, all with respect to the parameter continuation step. We indicate our judgment on the results in color. That is, if a result is accepted (i.e., ) we plot the marker in green, and if a result is rejected (i.e., ) we plot the marker in red. The optimal value is plotted in blue. The plots correspond to the results reported in Table 9.

