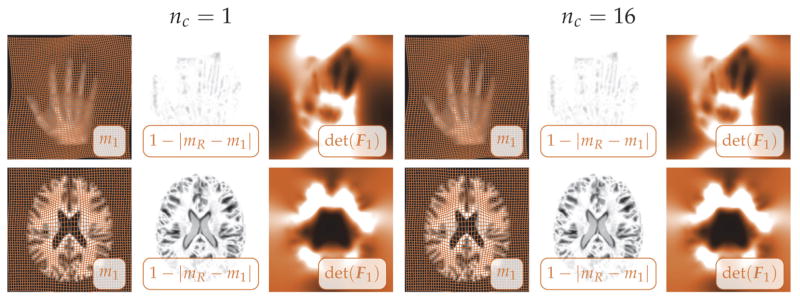
Figure 8.
Qualitative comparison of exemplary registration results for nc = 1 (images to the left) and nc = 16 (images to the right) of the study reported in Table 8. We refer to Table 8 and the text for details on the experimental setup. We report results for the hand images (nx = (128, 128)⊤) and the brain images (nx = (200, 200)⊤) for plain H2-regularization. We display (for each experiment) the deformed template image m1, a pointwise map of the absolute difference between mR and m1, and a map of the determinant of the deformation gradient det(F1) (from left to right as identified by the inset in the images). Information on how to interpret these images can be found in Appendix D.

