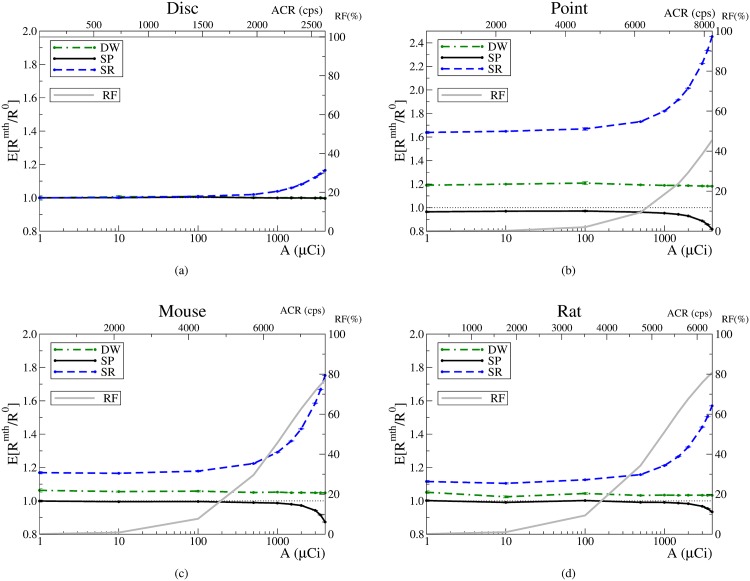
Fig 3. Estimated random rates and random fractions.
Error bars correspond to one standard deviation. Estimates provided by the ideal method are represented as a horizontal dotted line; SP: solid line; SR: dashed line, and DW: dotted–solid line. The average singles count rate (ACR) per detector is shown in the upper x axis. The RF is represented by a grey solid line.

