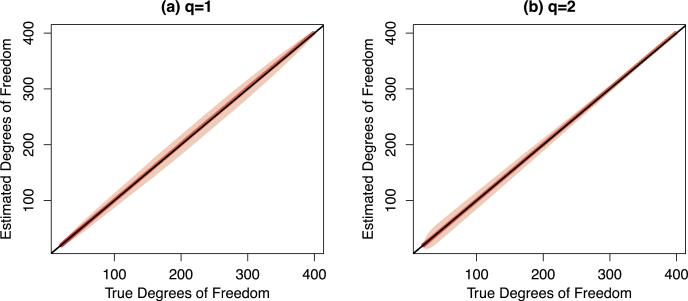
Fig 1.
We compare the true degrees of freedom of convex clustering (x-axis), given in (18), to the proposed unbiased estimators of the degrees of freedom (y-axis), given in Lemmas 8 and 9. Panels (a) and (b) contain the results for convex clustering with q = 1 and q = 2, respectively. The red line is the mean of the estimated degrees of freedom for convex clustering over 500 data sets, obtained by varying the tuning parameter λ. The shaded bands indicate the point-wise intervals of the estimated degrees of freedom (mean ± 2 × standard deviation), over 500 data sets. The black line indicates y = x.

