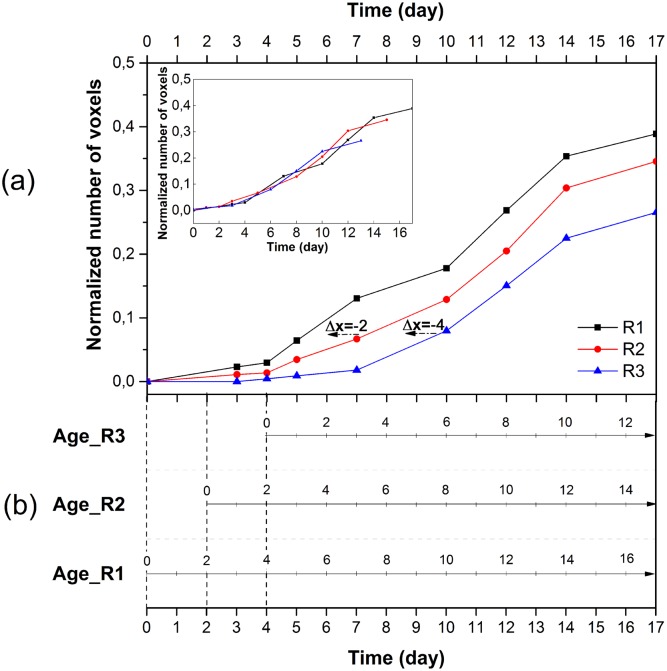
Fig 5. Age of region for R1, R2 and R3.
(a) Biomass growth measured throughout the 4 portions of R1, R2 and R3 as a function of days after inoculation (the inset graph shows the three curves translated by Δx). (b) The starting time of growth for R1, R2 and R3 is the inoculation day, the second day and the fourth day. The age axis is related with time axis to determine the age of each region on different observation days (E.g. the age of R1 on the 12th day is 12 days old but 10 and 8 days old for R2 and R3; the R1, R2 and R3 are 10 days old respectively after 10 days, 12 days and 14 days.) The age of region represented approximately the age of the oldest hyphae in that region.

