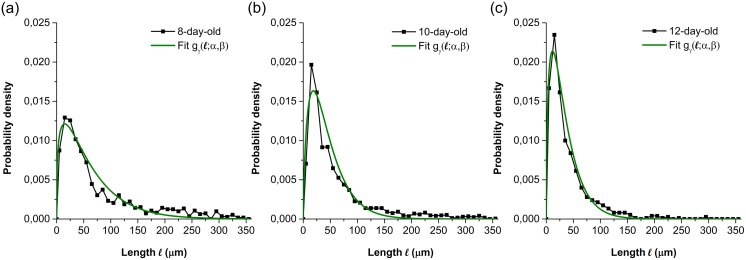
Fig 8. Branching length distributions at different hyphal ages and their fitted curves.
(a) 8-day-old (experimental data from R2 on the 10th day and R3 on the 12th day); (b) 10-day-old (experimental data from R1 on the 10th day, R2 on the 12th day and R3 on the 14th day); (c) 12-day-old (experimental data from R1 on the 12th day and R2 on the 14th day).

