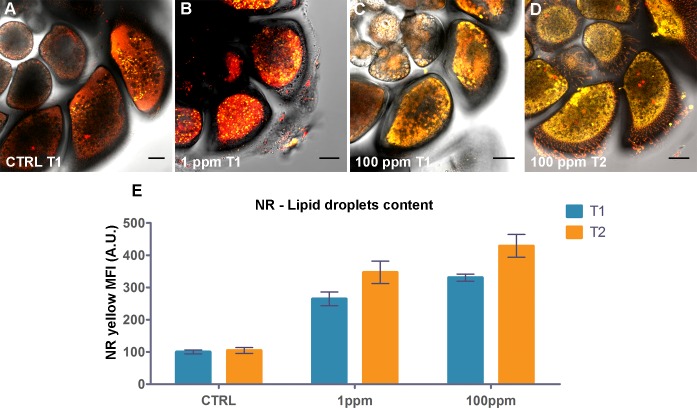
Fig 1. Effect of Hg exposure on lipid distribution of A. parkinsoniana labeled with NR.
Epifluoresecence micrographs of single optical sections showing overlay of NR yellow and red fluorescence for (A) T1- control, (B) T1-1 ppm, (C) T1-100 ppm and (D) T2-100 ppm, Bars: 20 μm. (E) Histogram of yellow Mean Fluorescence Intensity (MFI) expressed in arbitrary units (A.U.) for the three treatments over time (control, 1 ppm, and 100 ppm at both T1 and T2). Error bars indicate ± standard error of the mean.

