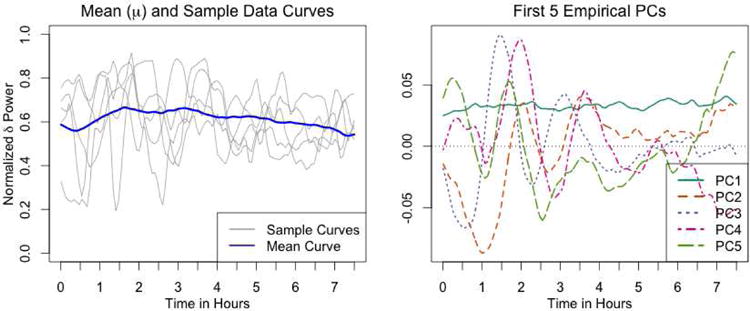
Figure 1.

Summary of EEG dataset - The left panel shows examples of normalized δ power (NPδ) over the course of the night for five subjects, as well as the mean NPδ function across all subjects (μ). The right panel shows the first five PCs of the dataset.
