Figure 4.
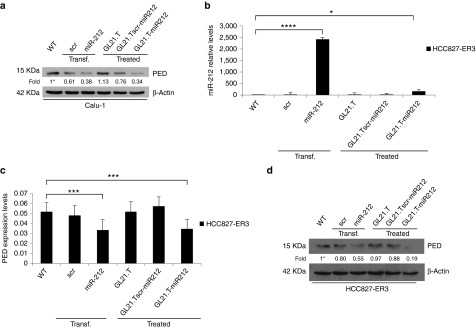
Effects of GL21.T-miR212 on additional Axl+ non-small cell lung cancer (NSCLC) cell lines. (a,d) Calu-1 and HCC827-ER3 cells were treated with 300 nM of GL21.T-miR212, GL21.Tscr-miR212, and GL21.T aptamer or, alternatively, transfected with 100 nM of pre-miR-212. After 72 hours for Calu-1 or 48 hours for HCC827-ER3, cells were collected and cell lysates were immunoblotted with anti-PED and anti-β actin antibodies for PED protein levels. (b) The same samples of HCC827-ER3 were subjected to qRT-PCR for miR-212 and (c) for PED expression levels analysis. In a,d values below the blots indicate signal levels relative to untreated cells (indicated as “WT”), arbitrarily set to 1 (with asterisk). Bands' intensity has been calculated as in Figure 2. In b and c each bar shows the mean ± SD values from three wells. Statistics were calculated using Student's t-test, ****p < 0.0001; ***p < 0.001; *p < 0.05.

