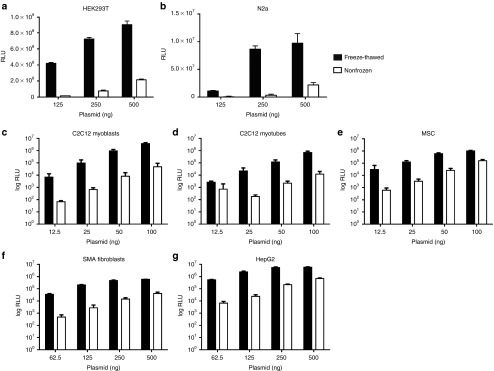
Figure 1.
Representative experiments comparing luc-plasmid transfection with nonfrozen versus freeze-thawed LF2000 in the following cell-lines: HEK293T (a), N2a (b), C2C12 myoblasts (c), C2C12 myotubes (d), hTERT MSCs (e), spinal muscular atrophy fibroblasts (f), and HepG2 (g). (c–g) Relative luminescence units (RLU) are depicted in log-scale. Each graph shows a representative experiment (mean + SD) in triplicates (24-well format; a,b,f, and g) or quintuplicates (96-well format; c–e).

