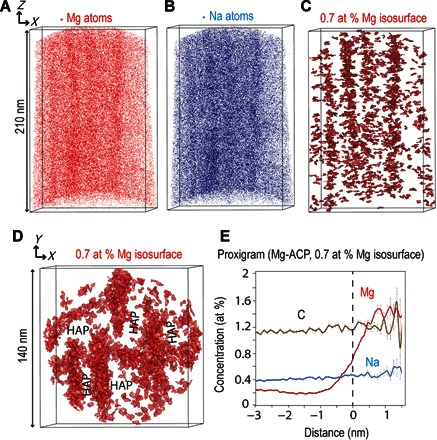
Fig. 2. APT reconstructed volumes of human dental enamel HAP nanowires showing intergranular Mg-rich ACP.

(A to C) Mg atoms (A), Na atom distribution (B), and 0.7 atomic % (at %) Mg isosurface (C) revealing the Mg-rich ACP between HAP nanowires. (D) Cross-sectional view of 0.7 at % Mg isosurface that highlights the ribbon-like shape of the HAP nanowires. (E) Proximity histogram (proxigram) from Mg-rich ACP based on 0.7 at % Mg isosurface [based on the sum of interfaces shown in (D)].
