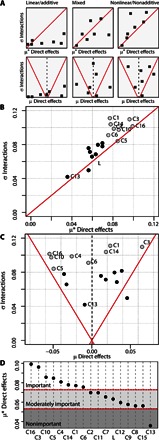
Fig. 5. GSA-QHTS is able to characterize global drivers of low-dose mixture sublethal effects.

(A) GSA schematic representation of input factor distributions along μ*-σ and μ-σ Cartesian planes for linear/additive, mixed, and nonlinear/nonadditive systems. (B and C) GSA results in the μ*-σ and μ-σ Cartesian plots, respectively, for the 17 input factors [16 PPCPs (C1 to C16) and light intensity (L)] analyzed in the present study. Red lines indicate the limits for linear additive systems. For clarity, only important and nonimportant input factors are identified in the figure. Hollow symbols indicate important factors (larger separation from the μ*-σ or μ-σ plane origin). (D) Ranked input factors by importance (μ*) showing the proposed limits (red dashed lines) for important, moderately important, and nonimportant factors.
