Figure 3.

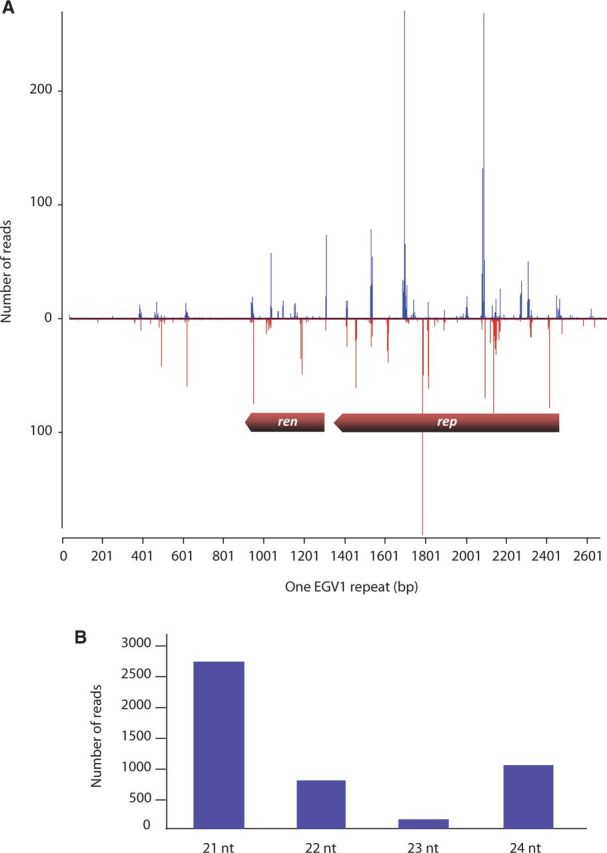
(A) EGV1 sequence coverage following Illumina-based siRNA analysis of the D. alata acc. W10-223 plant. The graphs plot the number of 21–24 nt siRNA reads at each nucleotide position of ren and rep; bars above the axis represent sense reads starting at respective positions; those below the antisense reads ending at respective positions. The genomic organization of EGV1 (rep and ren genes) is schematically shown. (B) Size distribution of siRNAs mapping to EGV1 sequence.
