
Figure 2.
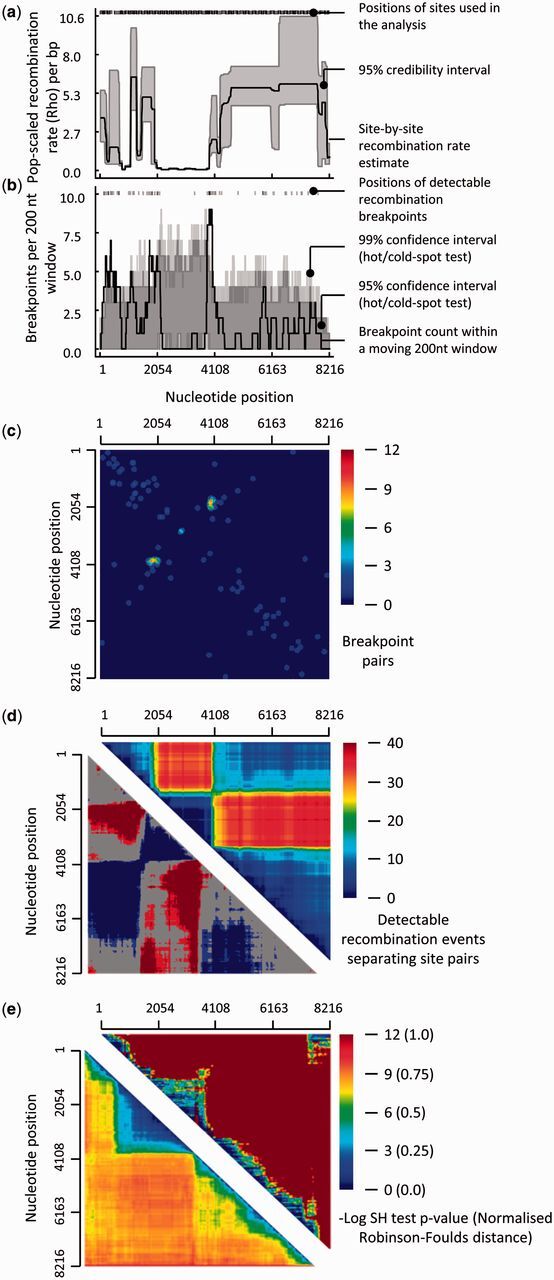
Examples of tools that are available in RDP4 for visualising overall patterns of recombination. The dataset examined here is the foot-and-mouth disease virus (FMDV) full genome dataset analysed in Heath et al. (2006; see the file, Example3(FMDV).rdp, that is distributed with RDP4). (a) Population-scaled recombination rate plots indicating variations in basal recombination rates across FMDV genomes and the presence of a likely recombination cold-spot between nucleotide positions ∼2000 and ∼4000. (b) Recombination breakpoint density plots indicating the presence of two recombination breakpoint hotspots at nucleotide positions ∼1900 and ∼4100. (c) Recombination breakpoint pair matrix. The yellow-red spot indicates that whenever a breakpoint occurs at nucleotide position ∼1900, there is a very strong tendency for a second breakpoint to occur at position ∼4100 (i.e., positions 1900 and 4100 are not only breakpoint hotspots: they are a breakpoint hotspot pair). (d) Recombination region count matrix. The top half of the matrix indicates that nucleotide site positions that are bounded by the recombination hotspots indicated in (b) tend to be co-inherited from the same parental virus (indicated by the dark blue triangle representing all pairs of sites between nucleotide positions ∼1900 and ∼4100). The bottom half of the matrix indicates site-pairs that are significantly more (in blue) or less (in red) frequently co-inherited during recombination than would be expected under random recombination. (e) Phylogenetic compatibility matrices illustrating the overall phylogenetic impacts of recombination in this FMDV dataset. Both the Shimodaira–Hasegawa (upper half) and Robinson–Foulds (lower half) compatibility matrices demonstrate that phylogenetic trees constructed for different parts of region ∼2000 to ∼4000 (indicated by the large blue-green triangles off the diagonals of both matrices) tend to be less different from one another than phylogenetic trees constructed from similarly sized portions of sequence sampled from elsewhere along the alignment (indicated by red-orange colours): these matrices therefore support the finding in (a) that there is a recombination cold-spot between nucleotide positions ∼2000 and ∼4000.