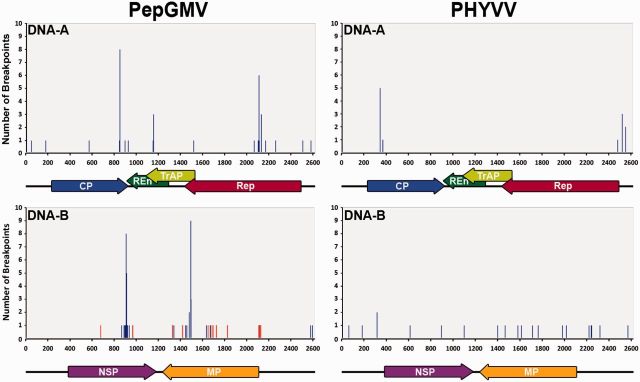
Figure 2.
Distribution and abundance of recombination breakpoints in both the DNA-A and the DNA-B of PepGMV and PHYVV. x axis indicates the position (nt) of each intra-specific (blue line) and inter-specific (red line) recombination breakpoint in each component of the viral genome. Colored arrows denote the position and orientation of each gene. CP, blue; REn, green; TrAP, yellow; Rep, red; NSP, purple; MP, orange. y axis indicates the number of virus isolates in which each recombination breakpoint was detected.

