Figure 1.
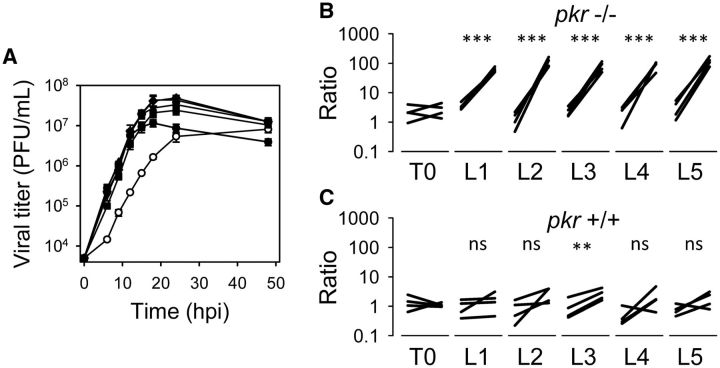
VSV adaptation to pkr-/- MEFs. (A) Growth curve of the five evolved lines (filled circles) and the founder (T0) virus (open circles). Each line was assayed in triplicate. Error bars indicate the standard error of the mean. (B) Competition assays of the T0 and evolved viruses against a common, phenotypically marked competitor in pkr -/- MEFs. Each line represents the change in the ratio of the assayed virus to the common competitor after a single 24 h transfer and corresponds to one replicate assay. Four replicates were performed for each competition. (C) Competition assays in pkr +/+ MEFs were performed in the same way as in (B).

