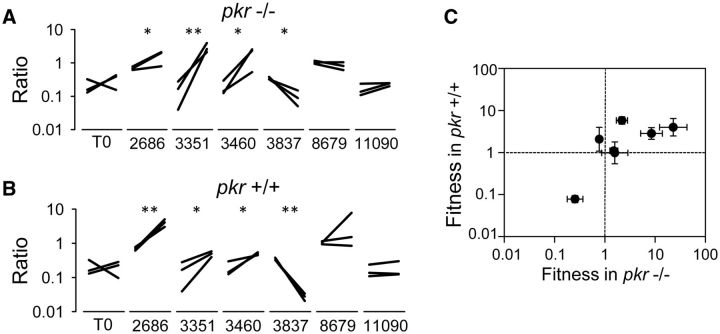
Figure 3.
Individual fitness effects of parallel substitutions. (A) Competition assays of the T0 and single mutants against a common, phenotypically marked competitor in pkr -/- MEFs. Each line represents the change in the ratio of the assayed virus to the common competitor after a single 24 h transfer. Three replicates were performed for each competition. (B) Competition assays in pkr +/+ MEFs. (C) Correlation between fitness in pkr −/− and pkr +/+ cells. Error bars represent the standard error of the mean

