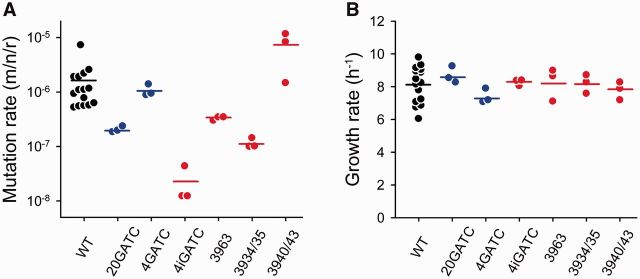
Figure 2.
Effect of different GATC sequence motifs on the mutation rate and growth rate of ϕX174. Mutation rates estimated by the Luria–Delbrück fluctuation test (A) and growth rates obtained in these same assays (B) for the WT virus (n = 15) and GATC mutants (n = 3) are shown. gATC mutants containing only synonymous substitutions are shown in blue, whereas those containing at least one intergenic substitution are shown in red. Each dot represents an individual estimate and horizontal bars indicate the mean. See Table 1 for details.

