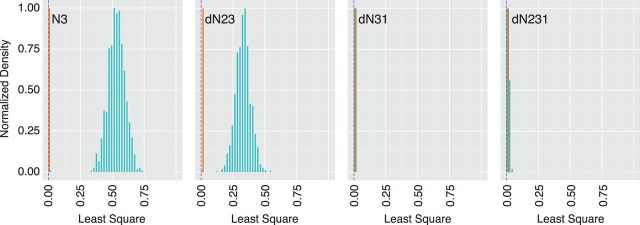
Figure 2.
Dinucleotide bias of permuted sequences. Distribution of least squares values (x axis, see text) for 1,000 permuted sequences generated from each of the four permutation scripts, indicated in top left of each panel. Values for permuted sequences are shown in green and values for the reference set of eighty-nine enteroviruses are shown in orange. Purple dashed line is the value for the wild-type poliovirus capsid (Type 1, Mahoney). Of the four permutation approaches, dN31 and dN231 had little to no effect on the dinucleotide bias. This is consistent with a previously observed bias in GC content in the third codon and first codon positions of poliovirus (Belalov and Lukashev 2013).

