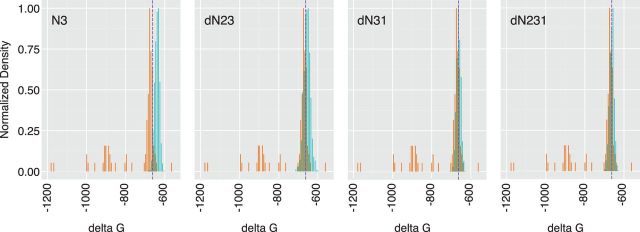
Figure 6.
RNA structure in permuted sequences. Distribution of minimum free energy values (x axis) of 1,000 permuted sequences generated from each of the four permutation scripts, indicated in top left of each panel. Values for permuted sequences are shown in green and values for the reference set of eighty-nine enteroviruses are shown in orange. Purple dashed line is the value for the wild-type poliovirus capsid (Type 1, Mahoney).

