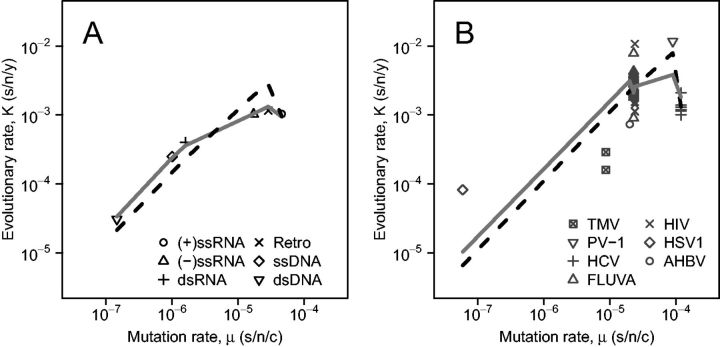
Figure 2.
Fitting the within-host analytical and deleterious mutation models to virus data. (A) Log-scale mean evolutionary rates against mutation rates for each Baltimore class (data from Sanjuán (2012) and Sanjuán et al. (2010), respectively). (B) Evolutionary rates against mutation rates for individual viruses. For both (A) and (B), the solid line represents the deleterious mutation model prediction, while the dashed line indicates the prediction from our within-host analytical model. TMV, tobacco mosaic virus ((+)ssRNA); PV-1, poliovirus-1 ((+)ssRNA); HCV, hepatitis C virus ((+)ssRNA); FLUVA, influenza A virus ((-)ssRNA); HIV, human immunodeficiency virus (retro); HSV1, herpes simplex virus 1 (dsDNA); AHBV, avian hepatitis B virus (retro).

