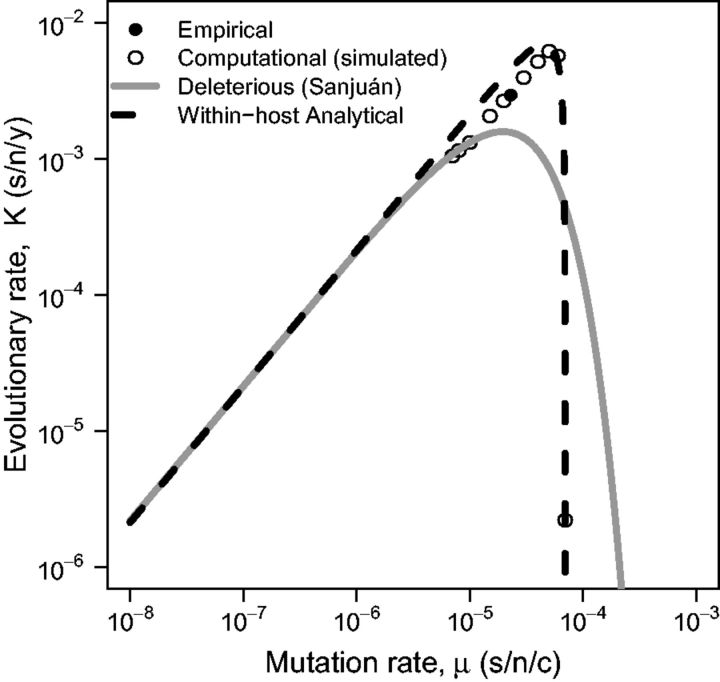
Figure 3.
Between-host evolutionary rate (s/n/y) against the mutation rate (s/n/c) for influenza A virus (). Data simulated using the computation model (open points, ) predicted by the deleterious mutation model implemented by Sanjuán (2012) (solid line, ), and predicted by our within-host analytical model (dashed line, ). Lines represent values calculated from the models based on independently estimated parameters and are not fit to the simulation (open) points. The simulation data closely approximates the reported value of influenza A virus evolutionary rate (closed point). Parameter values for both the computational and analytical models are defined in Table 1.

