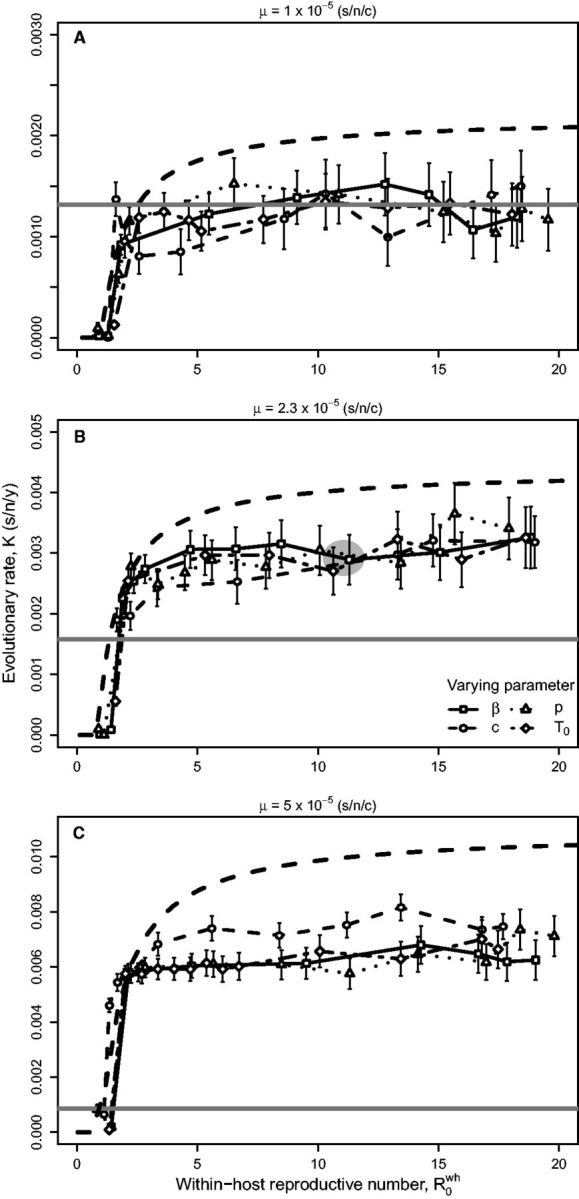
Figure 4.

Between-host evolutionary rate (s/n/y) against within-host reproductive number . Different specific within-host parameters were varied in the computational model to result in the range of values, with mutation rate held constant at (A) , (B) , or (C) (s/n/c). Solid (gray) lines indicate the predicted evolutionary rate by the deleterious mutation model used by Sanjuán (2012), while the dashed (black) lines indicate the predicted rates by our analytical model. Lines represent values calculated from the models using independent parameter estimates (Table 1) and are not a fit to the simulation points. The gray shaded area in (B) represents the empirical value of influenza (one standard error in each direction). Within-host parameter variables are cell infection rate , virus production rate , virus clearance rate , and initial number of target cells .
