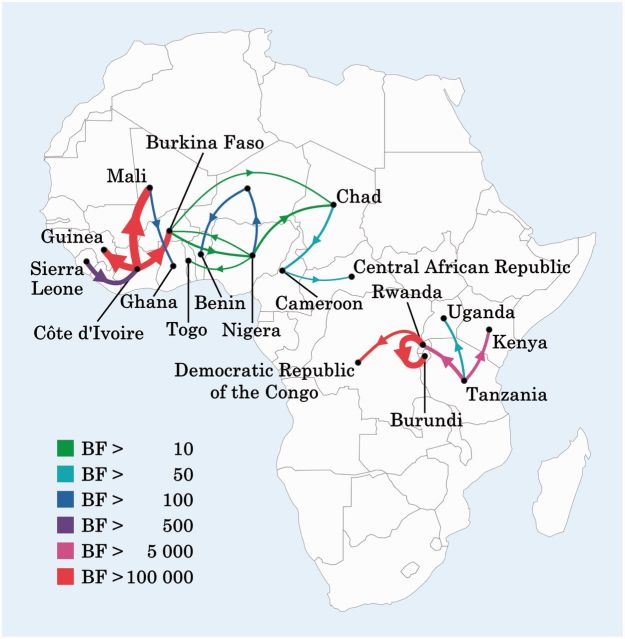
Figure 4.
BF test support for discrete diffusion rates. Rates supported by a BF > 4 are indicated. The line colour represents the relative strength by which the rates are supported: green lines and red lines suggest relatively weak and strong support, respectively. The thickness of the arrows indicates increasing number of Markov jumps between locations.

