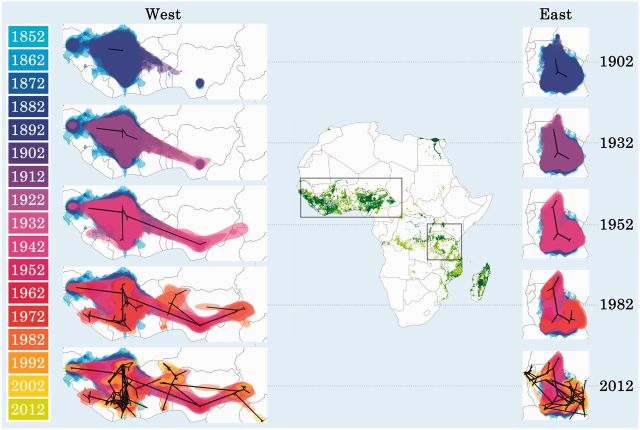
Figure 6.
Reconstruction of the continuous spatiotemporal dispersal of RYMV in West and East Africa, shown from 1852 to 2012 at intervals that capture the major dispersal events. Black lines show a spatial projection of the representative phylogeny. Coloured clouds represent statistical uncertainty in the estimated locations of RYMV internal nodes (95% HPD intervals).

