Figure 6.
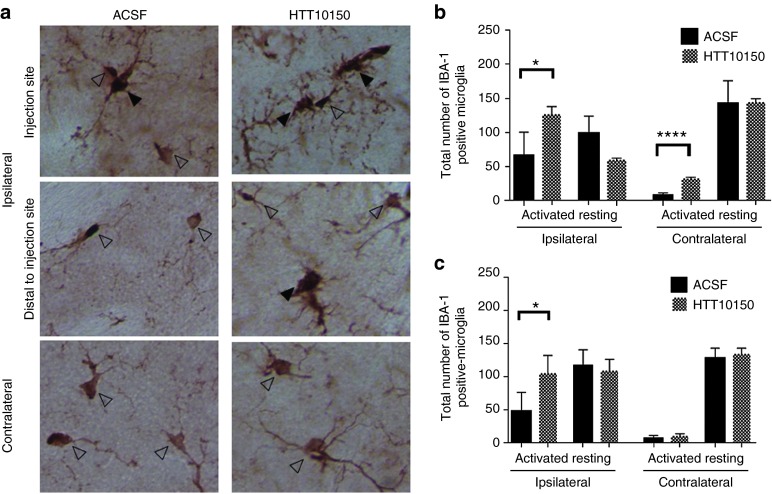
HTT10150 shows a twofold increase in microglial activation at the site of injection. HTT10150 was unilaterally injected into the striatum of WT (FVB/NJ) mice. Brains were collected after (b) 6 hours and (a, c) 5 days fixed, sectioned, and stained with antibodies against IBA-1. (a) Representative images of activated (black arrow) and resting (open arrow) after injection of 12.5 µg HTT10150 and ACSF 5 days post-injection, ×40 magnification. (b) Quantification of activated and resting microglia 6 hours post-injection of ACSF (n = 6 mice, mean ± SD) and 12.5 µg HTT10150 (n = 3 mice, mean ± SD). P values calculated by unpaired t-test, t = 9.996, df = 7: ACSF versus HTT10150 activated microglia ipsilateral striatum, P = 0.0239. ACSF versus HTT10150 activated microglia contralateral striatum, P < 0.0001. (c) Quantification of activated and resting microglia 5 days postinjection of ACSF (n = 4 mice, mean ± SD) and 12.5 µg HTT10150 (n = 3 mice, mean ± SD). Images are representative, results confirmed in separate images of all injected brains. P values calculated by unpaired t-test, t = 2.700, df = 5: ACSF versus HTT10150 activated microglia ipsilateral striatum P = 0.0428.

