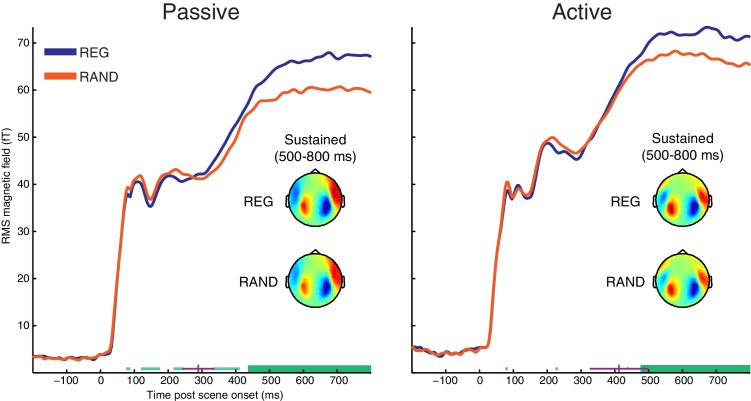
Figure 2. RMS time-course of the scene-evoked response showing the main effect of scene temporal structure (REG versus RAND).
Thick horizontal green lines indicate time points for which there were significant differences between REG and RAND conditions (p<0.05 FWE corrected at the cluster level; Thin light-green lines show uncorrected clusters). Purple lines indicate (jackknife-estimated) latencies of the onset of the REG versus RAND effect (horizontal and vertical portions indicate mean and jackknife-corrected standard error, respectively). Also shown are topographical patterns at the time of the sustained response (500–800 ms post scene onset), which are characterized by a dipole-like pattern over the temporal region in each hemisphere indicating downward flowing current in auditory cortex (red = source; blue = sink).

