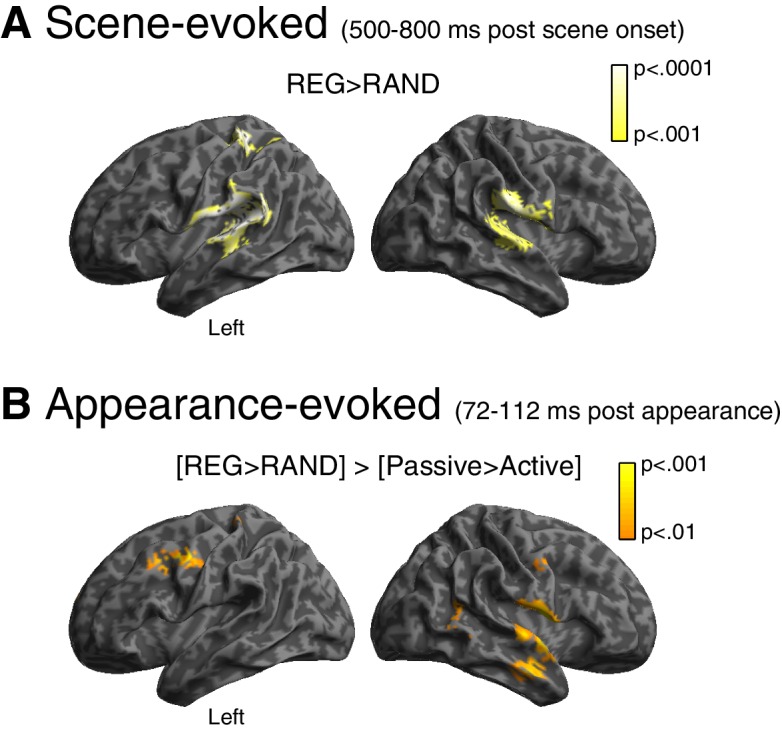
Figure 4. Source reconstruction.

(A) Main effect of scene temporal structure at the time of the sustained portion of the scene-evoked response (500–800 ms post scene onset). Statistical map is overlaid onto an MNI space template brain, viewed over the left and right hemispheres. Color-bar indicates statistical threshold. (B) [REG>RAND]>[Passive>Active] interaction at the time of the appearance-evoked M50 component (72–112 ms post appearance).
