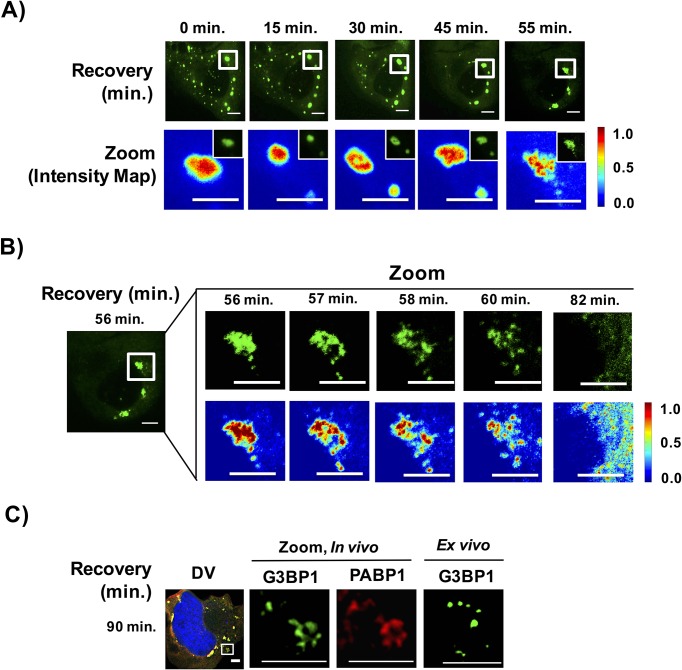
Figure 11. Stress granules disassemble through multiple discrete steps.
(A) Time-lapse imaging of stress granule disassembly in normal media following 60 min of NaAsO2 stress using a 100X objective. Intensity map represents relative gray scale intensity of zoomed inset. (B) Same as (A) imaged during stress granule fracturing. (C) In vivo GFP-G3BP1 stress granules were stained with PABP1 (Alexa-647 labeled secondary) and ex vivo GFP-G3BP1 stress granules cores imaged by deconvolution microscopy (DV) following 90 min of recovery from NaAsO2 stress. All scale bars are 5 μm.

