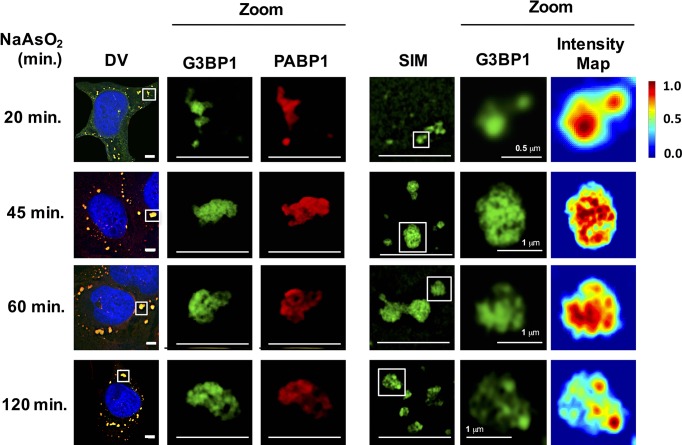
Figure 3. Early and late stress granules contain a non-uniform substructure.
GFP-G3BP1 stress granules were stained with the stress granule marker PABP1 and imaged by deconvolution microscopy (DV) following NaAsO2 stress at different time points. GFP-G3BP1 was assessed in the same cells by structured illumination microscopy (SIM). Intensity map represents relative gray scale intensity. Zoom represents magnified inset. Unless otherwise noted, all scale bars are 5 μm.

