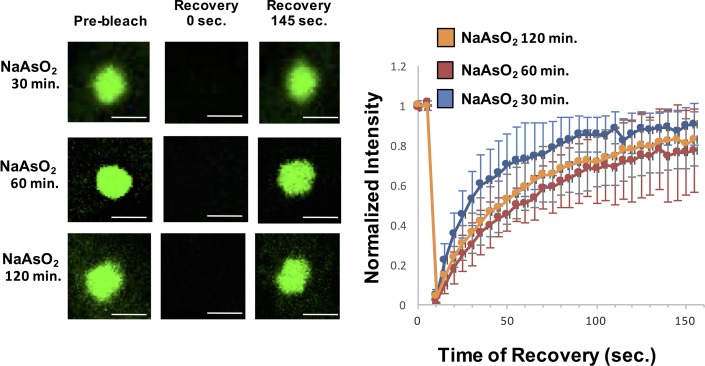
Figure 5. Similar GFP-G3BP1 stress granule dynamics during early and prolonged stress.
Granules shown prior to photobleaching, at 0 s, and at 145 s after photobleaching. Cells were treated for either 30, 60, 120 min with NaAsO2. Graph shows recovery curves as an average of 6 granules ± standard deviation at each respective time point. Scale bars are 1.5 μm.

